


This past second quarter, the Vietnamese stock market really heated up. Liquidity rose, individual investors returned, and securities firms were the first to benefit. But standing out most among them is still a familiar name: SSI.
Not only leading in scale, SSI just announced its Q2/2026 business results with numbers that make the rest of the industry look up in awe. Join Happite as we dissect how this “giant” made money during a booming market quarter.
The quick summary in 3 lines:
SSI reported a post-tax profit of 1.475 trillion VND for Q2/2026, up 75% from the previous quarter. All three main segments grew strongly: proprietary trading (+98%), margin lending (+60%), and brokerage (+196%). Margin debt exceeded 40,000 billion for the first time, consolidating its absolute #1 position in the securities industry.
- Where SSI’s 1.475 trillion profit in Q2/2026 came from
- Where SSI stands compared to VND, HCM, VCI, and MBS
- Risks to watch when investing in securities stocks
The “3-pillar machine” — where does the money come from?
Unlike manufacturing or retail businesses, securities firms make money in a very unique way. For SSI, the 4.177 trillion VND revenue in Q2 came from three main sources:
| Revenue Source | Q2/2026 (Billion) | Weight | QoQ Growth |
|---|---|---|---|
| Proprietary Trading Profit (FVTPL) | 2,066 | 49.5% | +98% |
| Margin Lending Interest | 1,006 | 24.1% | +60% |
| Brokerage Revenue | 922 | 22.1% | +196% |
The proprietary trading segment accounts for nearly half of the revenue. SSI mainly invests in certificates of deposit (~27,000 billion) and bonds (~14,500 billion) within its FVTPL portfolio, helping proprietary trading profits reach 2,066 billion, nearly double the previous quarter.
But the real highlight lies in the brokerage segment. Revenue of 922 billion, nearly triple the previous quarter, directly reflects the market’s vibrancy. The more the market trades, the more fees SSI collects. This symbiotic relationship makes SSI both a “beneficiary” and a “catalyst” for market liquidity.
Margin lending also reached a new milestone. SSI’s margin debt hit 40,470 billion at the end of Q2, an increase of 3,500 billion in just one quarter. With common margin interest rates of 10-12% per year, this is SSI’s most stable and predictable income source.
SSI vs. the Rest — Who stands where?
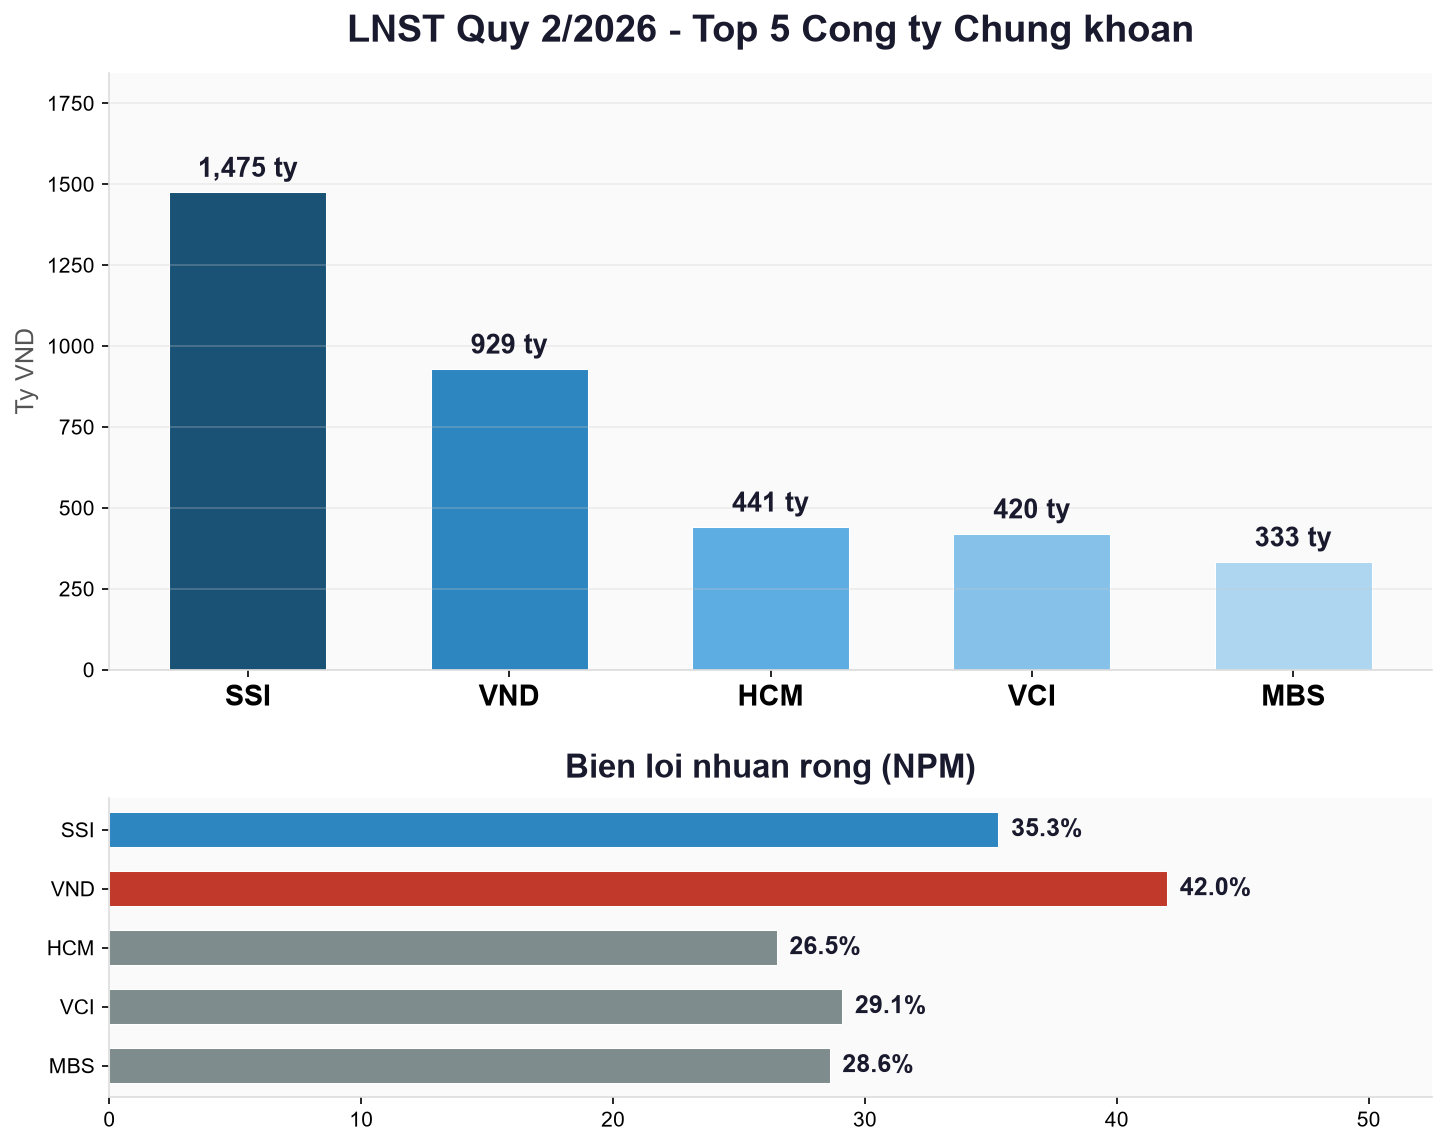
Placing SSI next to its industry peers, the gap becomes very clear:
| Company | Q2 Revenue | Q2 NPAT | Net Margin | QoQ Growth |
|---|---|---|---|---|
| SSI | 4,177 | 1,475 | 35.3% | +75% |
| VND | 2,214 | 929 | 42.0% | +143% |
| HCM | 1,665 | 441 | 26.5% | +94% |
| VCI | 1,443 | 420 | 29.1% | +43% |
| MBS | 1,162 | 333 | 28.6% | +24% |
A few noteworthy points from the comparison table:
SSI is the absolute leader in scale. SSI’s NPAT of 1.475 trillion is 1.6 times that of VND (ranked 2nd) and nearly 4.5 times that of MBS (ranked last). This scale advantage allows SSI to access cheaper capital and serve more customers.
VNDirect impressed with a net margin of 42%, the highest in the group. The company is growing very fast (+143% QoQ), but its scale is only about half of SSI’s.
All 5 companies showed positive QoQ growth. This is a signal that the entire securities industry is in an upward cycle, not just SSI.
What’s there to worry about?
No investment is perfect. For SSI, these are the risks to watch:
High financial leverage. SSI’s D/E ratio is at 1.41 times. The company is borrowing over 54,000 billion VND in short-term debt to fund its margin lending activities. When the market rises, this leverage amplifies profits. But if the market drops sharply, margin call pressure and bad debt will become real issues.
Dependence on FVTPL. Nearly 50% of revenue comes from proprietary trading. This segment fluctuates heavily with the market. A quarter where the market goes sideways or down could cause profits in this segment to evaporate significantly.
Interest expenses increased by 47.5%. From 466 billion to 687 billion per quarter. With interest rates potentially still rising, this is a cost that needs close monitoring, although the current ICR of 3.67 times remains at a safe level.
Valuation — expensive or cheap?
At a price of 22,700 VND/share, SSI is trading at a trailing P/E of 14.07 times and a P/B of 2.04 times.
With an ROE of 13.5%, a P/B of 2 times is reasonable. DuPont analysis shows that SSI’s ROE comes mainly from high profit margins (35.3%) and financial leverage (1.91x), while asset turnover is still low (0.20 times). If the market continues its uptrend, improved asset turnover will be the driver to push ROE above 15%.
Compared to historical averages, SSI is currently not cheap but not expensive for its industry-leading position in a favorable market environment.
FAQ
Q: Does SSI pay dividends?
SSI maintains a stable dividend policy, usually in cash or bonus shares, depending on each year’s plan.
Q: Why is SSI’s net margin lower than VND’s?
VND has a net margin of 42%, higher than SSI’s (35.3%), partly due to a different revenue structure and a smaller scale that allows for more flexible cost optimization.
Q: When will SSI’s full financial statements be available?
The Q2/2026 financial statements have been released. However, data on vnstock currently only includes business results; the balance sheet and cash flow statement will be updated in the coming days.
This article is for informational and educational purposes only, not investment advice. Figures are taken from SSI’s Q2/2026 financial statements, The Investor, and data from vnstock. You should do your own research or consult a licensed professional before making any decisions.